Written by : Diego Lapetina
Read Time: 6 minutes
Everyone in beauty agrees the market is soft. L’Oréal just made that sentence expensive.
H1 2026: €23.77 billion in sales, up 6.8% like-for-like, and a record 21.3% operating margin. And buried in the release, the detail that matters: they raised advertising and promotion spend by 70 basis points and still posted their most profitable half ever. So while most of the category is cutting marketing to protect margin this year, the leader bought more voice and grew margin anyway. The gap isn’t holding. It’s widening in real time.
This isn’t a new play. It’s the oldest verified play in marketing. Binet and Field’s analysis of the IPA databank found that every 10 points of excess share of voice, meaning spending above your market share, buys roughly half a point of market share growth per year, and the relationship holds across categories and geographies. Small number. Compounds ruthlessly. And downturns are when it compounds fastest: brands that invested in excess share of voice through the 2008 crisis achieved 4.5 times the annual market share growth of brands that cut, because when competitors go quiet, your voice gets louder for free. McGraw-Hill tracked 600 companies through the 1981-82 recession and found the aggressive advertisers’ sales had risen 256% over the cutters by 1985. Kellogg ran this play on Post in 1933 and kept the cereal category for 95 years.
So the rule is settled: soft years are when share changes hands, and it flows toward whoever holds excess share of voice.
Here’s the problem. If you’re an indie founder reading this, you can’t use the rule. Not because it doesn’t apply to you. Because you can’t measure it.
The measurement was built for conglomerates
Share of voice was defined in the era of bought media. You measured it through Nielsen or Kantar, firms that monitor tracked ad placements across a category and estimate each player’s spend. That works if your marketing is TV, print, and paid digital at scale.
Now look at how an indie builds voice in 2026. Founder content. Influencer seeding. Organic reach. Earned press. A newsletter. Almost none of it is bought placement, which means almost none of it registers in the tracking systems. Nielsen can see L’Oréal’s billions. It cannot see your 40 hours a week of content that just did 2 million organic views. On paper, your share of voice is zero. And even if the tracking captured you, the subscription costs more than your annual ad budget. The metric that decides who wins the soft market is, in practice, a members-only instrument.
The workaround: share of search
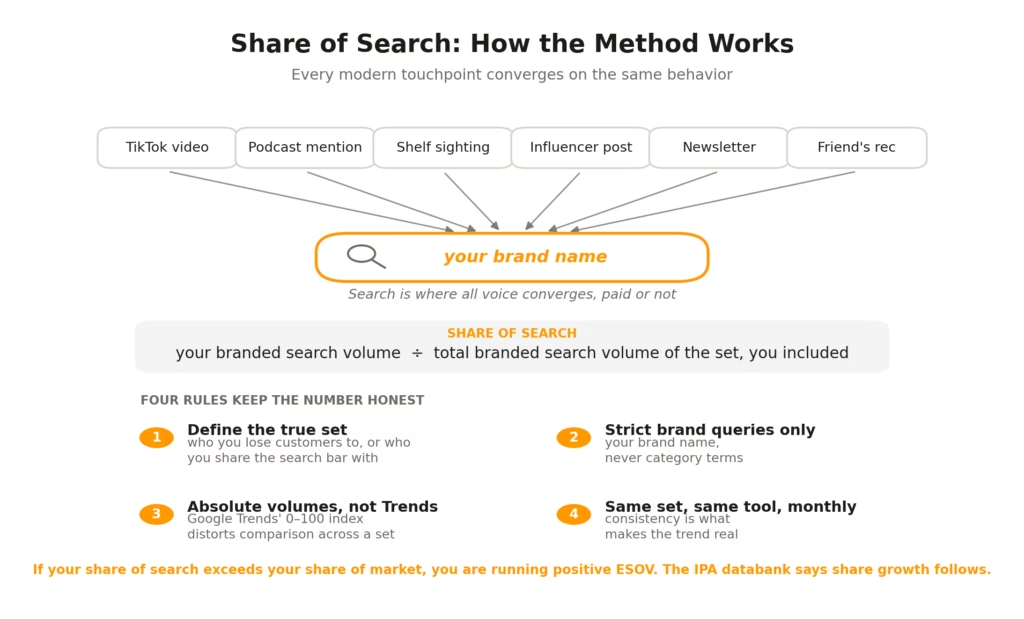
There’s a way out, and it comes from Binet himself. His follow-up research found that a brand’s share of category search volume tracks market share closely, and often leads it by months. The logic is clean. Search is the downstream convergence point of every modern touchpoint: a TikTok, a podcast mention, a shelf sighting, a friend’s recommendation all end in the same behavior, someone typing your name into a search bar. That’s why it captures the indie playbook instead of ignoring it.
And it’s measurable with tools you can afford. Here’s the method, and it fits in a formula:
Share of Search = your branded search volume ÷ total branded search volume of your set, you included.
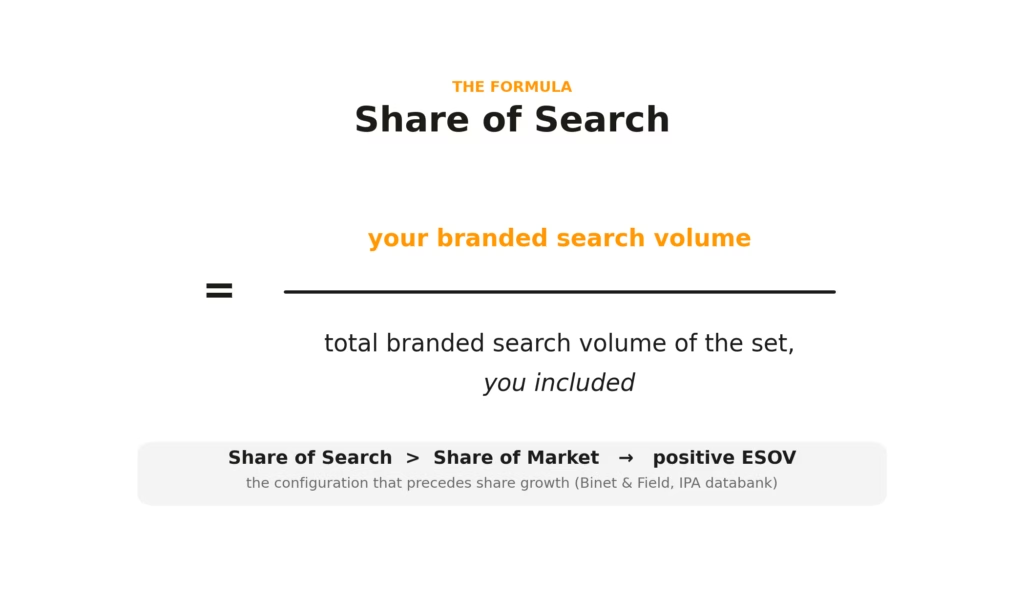
Four rules keep the number honest:
- Define the true set. Share of search measures an attention market, not a revenue market. For a product brand, the set is the brands you actually lose customers to. For a knowledge brand, it’s the names you share the search bar with, whoever your audience might type instead of you.
- Measure strict brand queries only. Your brand name, not category terms, and strip out any name that’s a dictionary word unless you can isolate the brand intent.
- Use absolute monthly volumes from a keyword tool, not Google Trends. Trends gives you a relative index of 0 to 100, which distorts comparison across a set. Trends is fine for direction, volumes are needed for share.
- Track it monthly, same set, same tool, so the trend is real.
If your share of search is bigger than your share of market, you’re running positive ESOV, and the databank says share growth follows.
A worked example: ours
We’d rather show our own numbers than hypothetical ones. Here’s Atomic Pom Labs measured this month via Semrush, US and Canadian databases. Reproducible by anyone with the same inputs.
First, the set. These aren’t our competitors in the revenue sense. Nobody in it does what we do, integrated brand strategy and product development under one roof. But when a beauty founder goes looking for industry intelligence, these are the names that share the search bar: BeautyMatter, Beauty Independent, CosmeticsDesign, Formula Botanica. Respected names, and exactly the right yardstick, because attention doesn’t care about business models. It flows to whoever it flows to.
Canada: our branded search now holds roughly 20% share of that set. Second most searched name in it. Twelve months ago that number was effectively zero, and nothing about paid spend explains the change, because there was no meaningful paid spend. It was built entirely through the channels the legacy tracking can’t see.
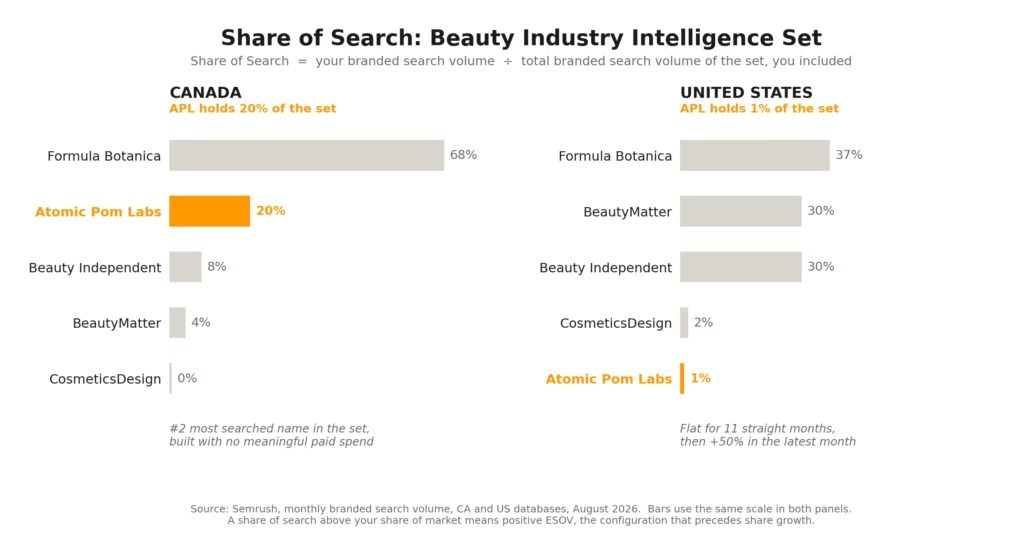
The US shows the other thing this metric does: early detection. Our share there sits near 1%, and our branded volume ran flat for eleven straight months, then ticked up 50% in the most recent one. In the legacy framework this signal doesn’t exist, because no ad spend ever registered anywhere. In share of search, it says mental availability is expanding ahead of everything else, which is exactly the window where the compounding decision gets made. Keep investing while it’s quiet, or cut and hand the window to someone else.
What the metric doesn’t do
Three caveats, because a useful number is only useful if you know its edges.
Search proves mental availability, not sales. Byron Sharp’s distinction applies in full: if people search for you and hit out-of-stocks, thin retail distribution, or a slow checkout, the interest decays before it converts. Check that your funnel can catch the surge before you scale the top of it.
Some search never reaches Google. People increasingly search inside TikTok, Amazon, and Sephora directly, and that behavior stays invisible. But the gap is closing fast, and in your favor. As of July 2026, Google’s new Search Console platform properties let you connect your Instagram, TikTok, X, or YouTube account, no website required, and see exactly which Google queries surface your posts. Pair that with UTM-tagged links feeding Google Analytics and, for the first time, an indie can watch organic social content convert into search demand on the same free dashboard. The proxy isn’t complete. It’s the most complete it has ever been, and it costs nothing.
And volume has no sentiment. A controversy spikes search too. Share of voice can be share of noise, so read the number alongside what people are actually saying.
The takeaway
The soft market rule hasn’t changed in 95 years: the gap is built in the quiet years, by whoever keeps buying voice while everyone else protects margin. What’s changed is that, for the first time, you don’t need a conglomerate’s tooling to know where you stand.
Pull your set. Measure your share. If it’s bigger than your slice of the market, the oldest verified pattern in marketing says the soft year is working for you.
The giants have always been able to see the scoreboard. Now you can too.
What you need to know:
▸What is share of search?
▸How do you calculate share of search?
▸Why can't indie beauty brands measure traditional share of voice?
▸What is excess share of voice (ESOV)?
▸Does share of search predict sales?
▸Should a beauty brand cut marketing spend in a soft market?
Subscribe to our Newsletter.
Every couple of weeks, notes straight from the trenches — plus the keys to our growing library. Subscribe today and the Skincare Launch Playbook lands first.
Drop your email and enjoy.